
2,015 Wirral 18 to 24s were claiming in October, the most since August 2021 and up 305 in a year. The borough total rose to 7,095. Every ward's figures inside.
2,015 people aged 18 to 24 in Wirral were claiming unemployment-related benefits in October. It is the first time the figure has passed 2,000 since August 2021, when pandemic job losses were still unwinding.
The number is up 105 in a month and 305 in a year. (ONS claimant count via Nomis, October 2026)
The borough total rose as well. 7,095 people were claiming in October, 3.6 per cent of residents aged 16 to 64. That is 170 more than in September and the highest total since March 2025.
Young adults account for the whole yearly rise
Over the year, Wirral’s claimant count is up by 290. Claimants aged 18 to 24 rose by more than that on their own:
| Age group | October 2025 | October 2026 | Change |
|---|---|---|---|
| 18 to 24 | 1,710 | 2,015 | +305 |
| 25 to 49 | 3,770 | 3,765 | -5 |
| 50 and over | 1,300 | 1,305 | +5 |
| All ages | 6,805 | 7,095 | +290 |
The 25 to 49 and over-50 groups are flat on a year ago. The whole increase sits with young adults.
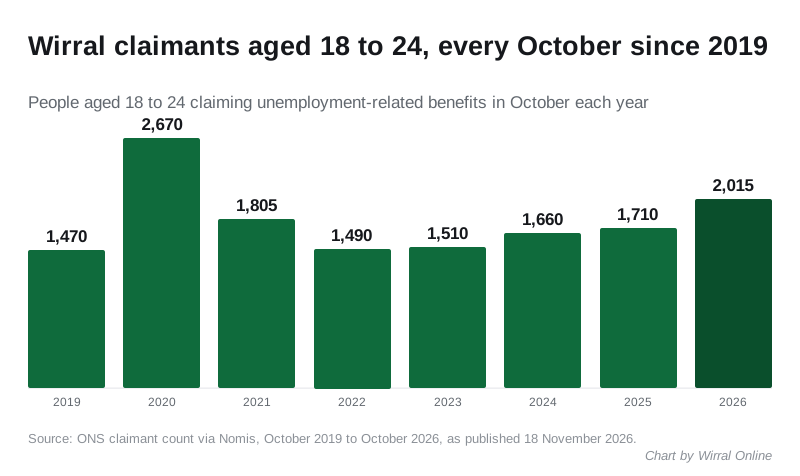
The October figure has risen every year since 2022, when it stood at 1,490. It is now 525 higher. It is also well above October 2019, before the pandemic, when it was 1,470.
How Wirral compares
Young adult claims are rising across the country, but faster here. Over the year to October:
- Wirral: 18 to 24 claimants up 17.8 per cent (1,710 to 2,015)
- North West: up 10.1 per cent (40,800 to 44,905)
- UK: up 9.3 per cent (315,505 to 344,930)
For all ages the gap is smaller. Wirral’s total rose 4.3 per cent over the year, against 4.6 per cent for the North West and 3.5 per cent for the UK. The borough’s rate of 3.6 per cent is below the UK’s 3.9 per cent, England’s 4.1 per cent and the North West’s 4.2 per cent.
Every Wirral ward, October 2026
| Ward | Claimants | % of 16 to 64s | Change on September | Aged 18 to 24 |
|---|---|---|---|---|
| Birkenhead and Tranmere | 1,095 | 9.2% | +10 | 275 |
| Seacombe | 665 | 6.7% | +30 | 180 |
| Bidston and St James | 630 | 6.0% | +35 | 195 |
| Rock Ferry | 595 | 5.7% | +20 | 165 |
| Liscard | 465 | 4.8% | +5 | 125 |
| Leasowe and Moreton East | 360 | 3.8% | -5 | 135 |
| New Brighton | 345 | 3.8% | +15 | 100 |
| Claughton | 330 | 3.6% | +20 | 100 |
| Upton | 340 | 3.5% | 0 | 95 |
| Prenton | 285 | 3.1% | +10 | 75 |
| Bromborough | 320 | 3.0% | -5 | 90 |
| Moreton West and Saughall Massie | 225 | 2.7% | +20 | 75 |
| Oxton | 215 | 2.6% | -5 | 55 |
| Wallasey | 190 | 2.3% | +10 | 65 |
| Eastham | 195 | 2.2% | +10 | 65 |
| Hoylake and Meols | 165 | 2.2% | +10 | 40 |
| Pensby and Thingwall | 135 | 1.9% | +5 | 30 |
| Bebington | 170 | 1.8% | +5 | 45 |
| West Kirby and Thurstaston | 115 | 1.6% | +5 | 35 |
| Greasby, Frankby and Irby | 110 | 1.4% | -10 | 35 |
| Heswall | 80 | 1.2% | -10 | 15 |
| Clatterbridge | 70 | 0.9% | +5 | 20 |
Ward figures are rounded to the nearest five, so small changes can be rounding. The ward totals add to 7,100, not the borough’s 7,095, for the same reason. The change column uses the revised September ward figures. (ONS claimant count by ward via Nomis)
Bidston and St James had the biggest rise in October, up 35, with Seacombe up 30. Birkenhead and Tranmere is now on 9.2 per cent, the highest rate in the borough.
Four wards along the Mersey hold 2,985 claimants between them:
- Birkenhead and Tranmere
- Seacombe
- Bidston and St James
- Rock Ferry
That is 42 per cent of the borough total, from four of its 22 wards. At the other end, Clatterbridge is on 0.9 per cent and Heswall on 1.2 per cent.
A revision to September
The ONS revises recent months as late claims come in. September’s figures have been revised down:
- the borough total from 7,055 to 6,925
- claimants aged 18 to 24 from 1,940 to 1,910
Our September claimant count story used the first figures and now carries a note.
What it means for you
The claimant count is not the unemployment rate. It counts people on Universal Credit or Jobseeker’s Allowance who are required to look for work. Someone in a low-paid or part-time job can be included. Someone out of work but not claiming is not.
Monthly figures move with the seasons, which is why the chart compares October with October. On that basis this is the highest October for 18 to 24s since 2020.
If you are 18 to 24 and looking for work in Wirral, two starting points:
- the council’s jobs and training support
- your nearest office through the DWP jobcentre finder
The ONS publishes the claimant count monthly through Nomis, free and down to ward level. The November figures are due in December.
Have your say