
The average Wirral home is now £215,575, up £15,645 in a year and rising more than four times faster than England. Terraces led at 9.1%, flats trailed at 5%.
The average Wirral home was worth £215,575 in June 2026. A year earlier it was £199,930. That is £15,645 added in twelve months, a rise of 7.8%.
England managed 1.8% over the same year. The North West managed 4.7%. Wirral is running at more than four times the England rate and well ahead of its own region (UK House Price Index, HM Land Registry).
One thing to hold on to before any of this is useful. The UK House Price Index figure is a mean average, not a median. A handful of large sales in Caldy or Heswall pull it upwards, and it covers the whole borough. It is not the price of a house in your street.
What rose fastest was the cheap end
The headline number hides the more interesting result. The steepest rises were not at the top of the market.
| Property type | Average, June 2026 | Change over the year |
|---|---|---|
| Terraced | £171,544 | +9.1% |
| Semi-detached | £245,227 | +8.4% |
| Detached | £385,588 | +6.7% |
| Flat or maisonette | £122,041 | +5.0% |
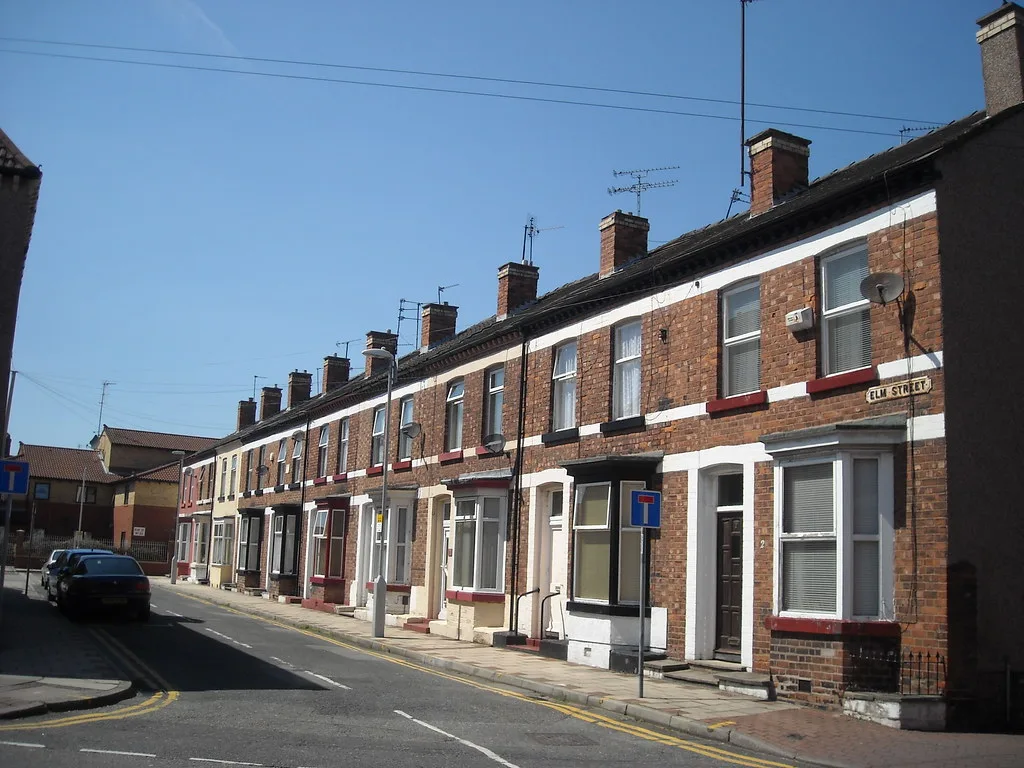
Terraced houses are the type most Wirral first-time buyers actually buy, and they went up faster than anything else. Flats did the opposite, adding 5.0% from the lowest base in the borough.
The gap between the two ends of the market is still enormous. The average detached house in Wirral costs £263,547 more than the average flat.
Wirral against its neighbours
Wirral sits just below the North West average and a long way below England. The peninsula is £77,687 cheaper than the England average and £4,347 cheaper than the region it is in.
Only one authority nearby rose faster over the year. St Helens went up 11.1%, from an average of £186,435. Everywhere else on Merseyside moved more slowly than Wirral: Liverpool 7.2%, Sefton 5.2%, Halton 3.7% and Knowsley 3.6%. Across the Dee, Cheshire West and Chester stayed the expensive neighbour at £269,039, but grew more slowly than Wirral at 6.9%.
The number has actually been falling since January
This is where the annual figure needs care. Wirral’s average price peaked at £222,658 in January 2026 and has come down in most months since.
| Month | Average price | Change on previous month |
|---|---|---|
| January 2026 | £222,658 | +2.2% |
| February 2026 | £222,115 | -0.2% |
| March 2026 | £220,677 | -0.6% |
| April 2026 | £215,423 | -2.4% |
| May 2026 | £215,705 | +0.1% |
| June 2026 | £215,575 | -0.1% |
That is £7,083 off the January figure. The 7.8% annual rise is real, but it was earned in the second half of 2025 and the first weeks of 2026. Since the spring the borough average has been flat.
The index revises, and ours did too
Anyone tracking this monthly needs to know that the UK House Price Index changes its own back numbers. Sales are added to the index as they are registered, so recent months are provisional and get restated.
Our own Wirral house prices page, written on 10 August, put the May 2026 borough average at £217,000. That was the figure the index carried at the time. The June release restates May as £215,705, about £1,300 lower. Neither number was wrong when published. Treat the newest two or three months of any UK House Price Index figure as provisional.
First-time buyers, and how many homes are selling
A first-time buyer in Wirral paid an average of £184,619 in June 2026. That is up 8.3% on a year earlier, a faster rise than the borough average. Buyers who already owned a home paid £256,490, up 7.3%.
Buyers using a mortgage paid £222,909, up 8.1%. Cash buyers paid £199,817, up 7.3%.
Sales volumes lag the price data by about two months, so May and June are not published yet. The most recent month on the record is April 2026, with 244 sales registered in Wirral. That is up from 204 in April 2025, a rise of about a fifth. More homes changed hands, not fewer.
What it means for you
- If you are selling: the borough average has not moved since April. The strong headline number is a year’s worth of growth, most of it already banked.
- If you own a terraced house: your type of home rose fastest in the borough over the year, at 9.1%.
- If you own a flat: yours rose least, at 5.0%, from the lowest base.
- If you are buying your first home: the first-time buyer average is now £184,619, and it is rising faster than the market as a whole.
- If you are comparing areas: the borough average is one number for thirteen postcode districts that are nothing like each other. Our Wirral house prices page gives the median sold price in each one, from Heswall down to Birkenhead.
- If you are working out running costs: the sale price is not the bill. Check the band on our Wirral council tax bands page.
Sources
- UK House Price Index, Wirral, June 2026, HM Land Registry, for every Wirral figure on this page: the average price, the annual and monthly changes, the breakdown by property type and buyer type, and the sales volumes.
- UK House Price Index for June 2026, HM Land Registry, published 19 August 2026, for the release date and the England and North West figures.
- Comparator authorities read from the same index for June 2026: Liverpool, Sefton, Knowsley, Halton, St Helens and Cheshire West and Chester.
Figures are from the UK House Price Index for June 2026, the most recent month published. Averages are mean prices. Recent months are provisional and are revised as more sales are registered.
Have your say