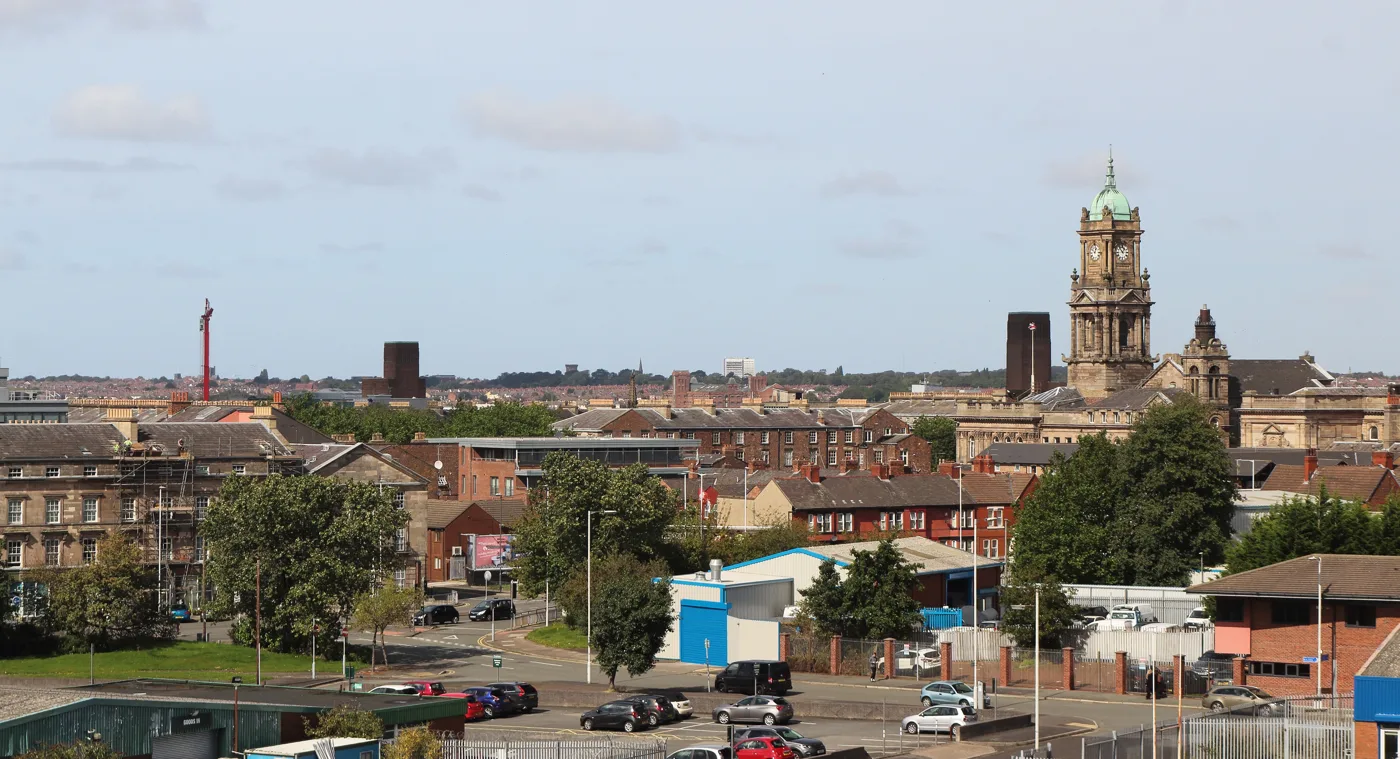

Wirral's claimant count fell over the year while the UK's rose. But 18 to 24s are up 150, and Birkenhead and Tranmere sits in the top 3% of English wards.
Wirral has 6,855 people claiming unemployment-related benefits, 3.5 per cent of residents aged 16 to 64. That is 80 fewer than a year ago, at a time when the UK total went the other way and rose 1.3 per cent. (ONS claimant count via nomis, July 2026)
The borough figure also sits below the national one. Wirral is on 3.5 per cent against 3.9 per cent across the UK, 4.0 per cent in England and 4.1 per cent in the North West.
Two things sit underneath that reassuring headline. The fall is happening in every age group except the youngest adults, whose numbers are climbing. And the borough average hides a ward gap of nearly ten to one.
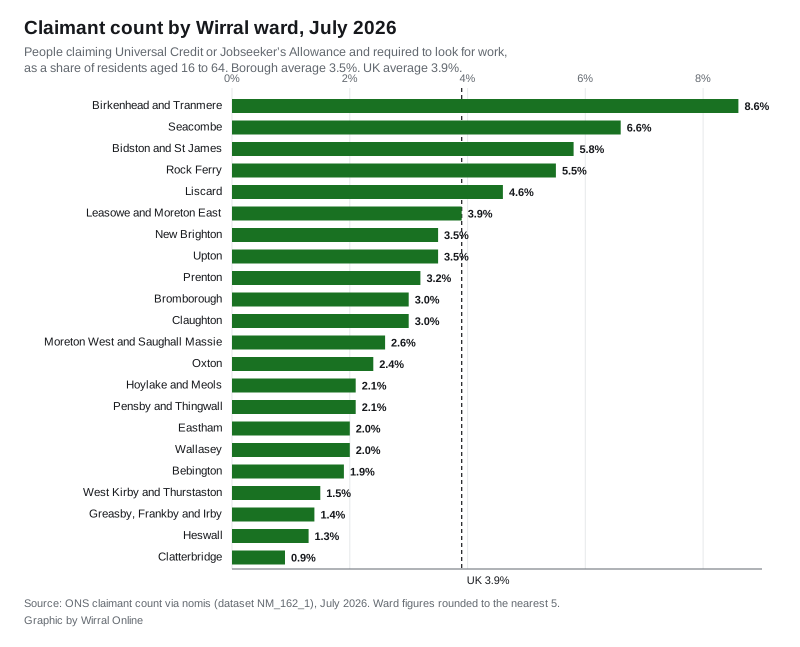
The gap between Birkenhead and Clatterbridge
Birkenhead and Tranmere ward is on 8.6 per cent. Of the 6,807 English wards with a published figure, only 154 are higher. It is more than double the UK rate.
Clatterbridge ward is on 0.9 per cent. Only 57 English wards in the whole country are lower.
Both are in the same borough, a little over four miles apart. The median English ward is on 2.7 per cent, so Wirral contains wards near the top and the bottom of the national range at the same time.
Four wards are above the UK average, and all four are in the older urban core along the Mersey:
- Birkenhead and Tranmere, 8.6% (1,030 claimants)
- Seacombe, 6.6% (655)
- Bidston and St James, 5.8% (600)
- Rock Ferry, 5.5% (580)
Those four wards hold 2,865 claimants between them, 42 per cent of the borough’s total from four of its 22 wards.
At the other end, the west coast and the rural south barely register:
- Clatterbridge, 0.9%
- Heswall, 1.3%
- Greasby, Frankby and Irby, 1.4%
- West Kirby and Thurstaston, 1.5%
One limitation worth stating plainly. The ward-level series only begins in January 2026, so there is no year-on-year comparison at ward level yet. The figures above are a July snapshot.
Every Wirral ward, July 2026
| Ward | Claimants | % of 16 to 64s | Aged 18 to 24 |
|---|---|---|---|
| Birkenhead and Tranmere | 1,030 | 8.6% | 260 |
| Seacombe | 655 | 6.6% | 175 |
| Bidston and St James | 600 | 5.8% | 165 |
| Rock Ferry | 580 | 5.5% | 150 |
| Liscard | 450 | 4.6% | 110 |
| Leasowe and Moreton East | 370 | 3.9% | 120 |
| Upton | 340 | 3.5% | 100 |
| Bromborough | 325 | 3.0% | 85 |
| New Brighton | 315 | 3.5% | 65 |
| Prenton | 295 | 3.2% | 75 |
| Claughton | 285 | 3.0% | 80 |
| Moreton West and Saughall Massie | 220 | 2.6% | 60 |
| Oxton | 205 | 2.4% | 40 |
| Eastham | 175 | 2.0% | 45 |
| Bebington | 170 | 1.9% | 45 |
| Wallasey | 165 | 2.0% | 45 |
| Hoylake and Meols | 155 | 2.1% | 35 |
| Pensby and Thingwall | 155 | 2.1% | 35 |
| Greasby, Frankby and Irby | 105 | 1.4% | 30 |
| West Kirby and Thurstaston | 100 | 1.5% | 30 |
| Heswall | 90 | 1.3% | 20 |
| Clatterbridge | 65 | 0.9% | 10 |
Ward counts are rounded to the nearest five and sum to 6,850 against a borough total of 6,855.
Under-25s are the exception to the good news
Wirral’s total fell by 80 over the year. Its 18 to 24 count rose by 150, from 1,630 last July to 1,780 this July, a rise of 9.2 per cent.
Of the ten other age bands the ONS publishes, only one rose at all: 40 to 44, up 25. The rest fell.
- 35 to 39: down 100, to 805
- 25 to 29: down 90, to 845
- 60 to 64: down 50, to 355
- 30 to 34: down 15, to 775
- 50 to 54: down 15, to 445
- 45 to 49: down 10, to 575
- 55 to 59: down 5, to 400
- 16 to 17: down 5, to 15
Every figure the ONS publishes at this level is rounded to the nearest five, so the bands do not add exactly to the borough total.
Young adults now make up 26 per cent of all Wirral claimants, up from 23.5 per cent a year ago. Over two years the shift is sharper still: there were 1,520 claimants aged 18 to 24 in July 2024, so the figure is up 260, or 17.1 per cent, since then.
To be fair to Wirral, this is not a local aberration. The UK’s 18 to 24 count rose 9.7 per cent over the same year, slightly faster than Wirral’s 9.2 per cent. Youth claims are rising almost everywhere. What is unusual here is the direction of everything else: in most places the total rose too.
Across Merseyside and the surrounding boroughs, the year-on-year picture looks like this:
| Area | Total, change on year | Aged 18 to 24, change on year |
|---|---|---|
| Wirral | -1.2% | +9.2% |
| Knowsley | -1.3% | +10.9% |
| St Helens | +0.3% | -0.5% |
| Liverpool | +0.5% | +9.4% |
| Sefton | +1.5% | +6.0% |
| Halton | +3.4% | +14.3% |
| United Kingdom | +1.3% | +9.7% |
Wirral and Knowsley are the two neighbours where the overall count fell. In both, young claims still went up.
The concentration matters as much as the total. Birkenhead and Tranmere alone has 260 claimants aged 18 to 24, and Seacombe 175. Between them those two wards hold nearly a quarter of the borough’s young claimants.
What it means for you
The claimant count is not the unemployment rate. It counts people claiming Universal Credit or Jobseeker’s Allowance who are required to look for work. Someone in a low-paid or part-time job can be included; someone out of work but not claiming is not. The unemployment rate comes from a separate ONS survey and is usually higher.
If you are 18 to 24 and out of work in Wirral, you are part of the one group here that is growing, which is worth knowing when you are told the local picture is improving. Two starting points: the council’s own training and employment support at Wirral Council, jobs and training, and your nearest office through the DWP jobcentre finder.
If you are looking at where to live or buy, these ward figures are one of the few free, current measures of local economic conditions, updated monthly. They track closely with our Wirral house prices page: the wards with the lowest claimant rates are the same ones at the top end of the market.
If you want to check a figure yourself, the ONS publishes the claimant count monthly through nomis, free and without a login, down to ward level. These July figures came out on 19 August, and the next release covers August 2026.
Related: Wirral planning news and Wirral trains to Liverpool.
Have your say